Hi guys 👋🏾, in this article I will be writing about how I got to set up XDebug to work in my Visual Studio Code editor for both my testing environment through the terminal and for browser request.
For someone pampered with the luxury of having a seamless debugging experience in Visual Studio IDE for C#, I also wanted to enjoy that comfort in a Laravel sail project setup. This led me to some exploration and luckily I found a light at the end of the tunnel.
Requirements
Browser Debugging
- I created a Laravel project setup called “mysail“
composer create-project laravel/laravel mysail
- I navigated to the newly created project
cd mysail
- I installed sail
php artisan sail:install
- I added this environment variable to activate XDEBUG for debugging sessions
SAIL_XDEBUG_MODE=develop,debug,coverage
- I started my sail environment
./vendor/bin/sail up
- I opened a new terminal and ran my migrations
./vendor/bin/sail artisan migrate
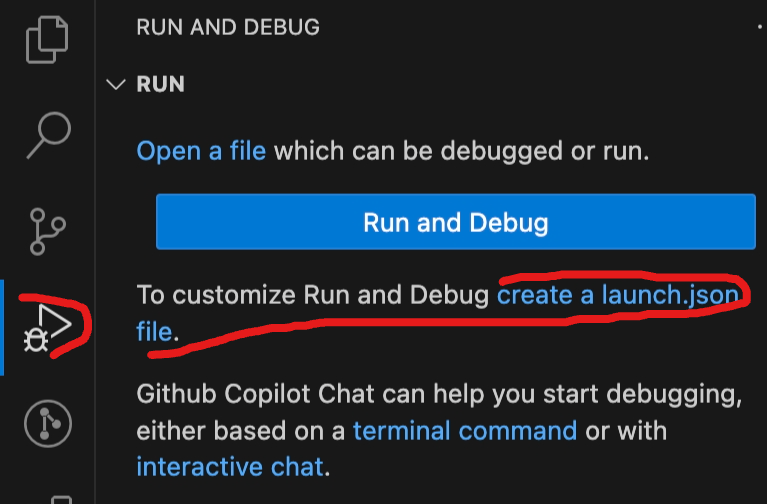
- I clicked on the “Run and Debug” option in VSCode
- I clicked on the “create a launch.json file“

- I clicked on the “PHP(XDebug)” option which opened some pre-configured debugging setup
- I looked for the one that had “Listen for Xdebug” and changed it from:
        {
            "name": "Listen for Xdebug",
            "type": "php",
            "request": "launch",
            "port": 9003
        },

     to this


        {
            "name": "Listen for Xdebug",
            "type": "php",
            "request": "launch",
            "port": 9003,
            "pathMappings": {
                "/var/www/html": "${workspaceRoot}"
            }
        },
The mapping enables the debugger to locate the right files to monitor set breakpoints.
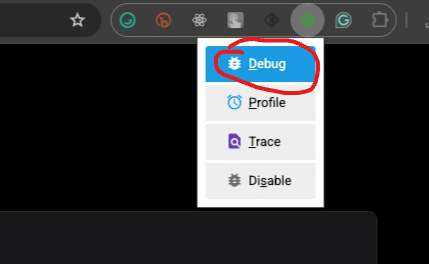
- In my browser, I activated the XDebug browser extension by clicking on the “Debug” option of the extension

- I added a breakpoint to the home route to test if it works
- I clicked on the “Listen for Xdebug” button to activate the debugging session

- Now navigating to the website URL (localhost) stops exactly at line 6
- Yay!! it works, next I wanted to ensure I could use it to debug my test.
- I tried using the default scaffolded test created in a new Laravel project
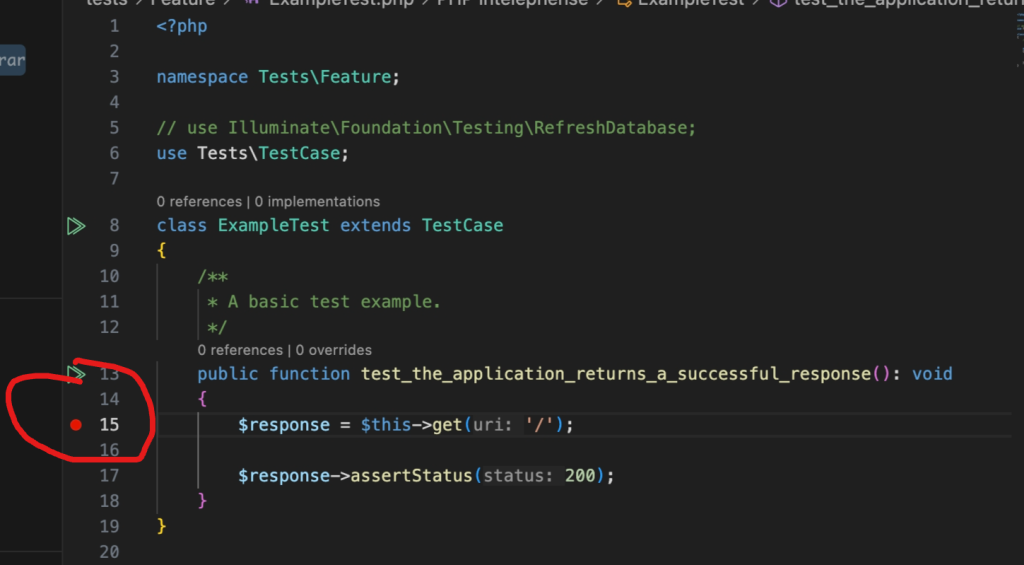
- I added a breakpoint here:

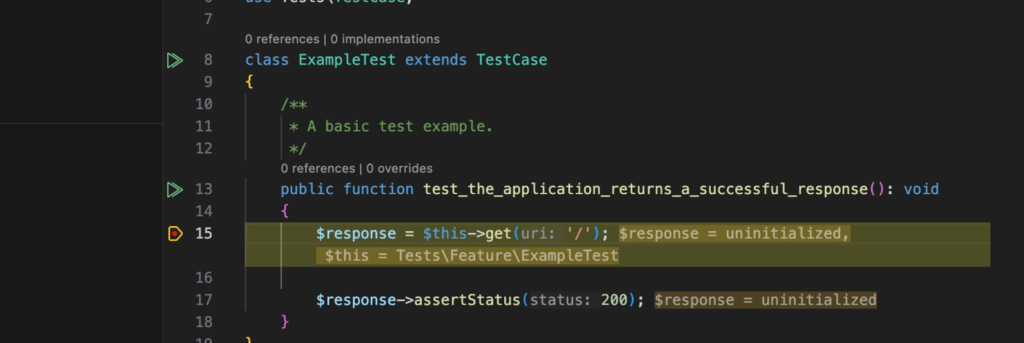
- I opened a new terminal and ran this “./vendor/bin/sail debug test –filter test_the_application_returns_a_successful_response” instead of “./vendor/bin/sail artisan test –filter test_the_application_returns_a_successful_response”
- Note the difference in replacing “artisan” with “debug“
- And that worked as well

Things to note:
- Set your env: SAIL_XDEBUG_MODE=debug,debug,coverage before running “sail up“
- Add the path mapping to your PHP debugger VSCode configuration
- Activate the XDebug browser extension by clicking the “Debug” option when debugging browser requests.
- For your terminal debugging activities replace the “artisan” command with the word “debug”
Thanks for reading and bye 👋🏾


Ceejay
Great content
Ashkan Ebtekari
I love how concise and straight to the point this article is. Great work as always, Samson. Thanks for sharing.
6000$ + 200 FREE SPINS. GET -> https://telegra.ph/6000--200-FREE-SPINS-02-05?hs=92485b8af8d615e7c702220a3ec24b1e&
5uefgp
+ 0.75338718 BTC.GET - https://telegra.ph/Get-BTC-right-now-01-22?hs=92485b8af8d615e7c702220a3ec24b1e&
pp6ffd
You have a email # 922695. Read > https://telegra.ph/Get-BTC-right-now-02-10?hs=92485b8af8d615e7c702220a3ec24b1e&
b6r1pg
+ 0.75831257 BTC.GET - https://graph.org/GET-BITCOIN-TRANSFER-02-23-2?hs=92485b8af8d615e7c702220a3ec24b1e&
zx9kjh
We send a gift from Binance. Take =>> https://graph.org/GET-BITCOIN-TRANSFER-02-23-2?hs=92485b8af8d615e7c702220a3ec24b1e&
w0apad
You have a message(-s) № 166136. Read > https://graph.org/GET-BITCOIN-TRANSFER-02-23-2?hs=92485b8af8d615e7c702220a3ec24b1e&
g3owiw
Sending a transfer from user. Take >> https://telegra.ph/Binance-Support-02-18?hs=92485b8af8d615e7c702220a3ec24b1e&
gf0txv
Ticket- + 0.75661059 bitcoin. Withdraw => https://telegra.ph/Binance-Support-02-18?hs=92485b8af8d615e7c702220a3ec24b1e&
rzxlpg
Evelyn, your BTC was successfully received. https://graph.org/Message--17856-03-25?hs=92485b8af8d615e7c702220a3ec24b1e&
hpf7mg
Notification; Process 1,731645 BTC. Next >>> https://graph.org/Message--04804-03-25?hs=92485b8af8d615e7c702220a3ec24b1e&
914a46
Reminder: TRANSACTION 1,725794 BTC. GET => https://graph.org/Message--04804-03-25?hs=92485b8af8d615e7c702220a3ec24b1e&
lhwlpf
+ 1.55308 BTC.NEXT - https://graph.org/Message--04804-03-25?hs=92485b8af8d615e7c702220a3ec24b1e&
u6eo44
+ 1.203626 BTC.NEXT - https://graph.org/Message--05654-03-25?hs=92485b8af8d615e7c702220a3ec24b1e&
xycan8
+ 1.555652 BTC.GET - https://graph.org/Ticket--58146-05-02?hs=92485b8af8d615e7c702220a3ec24b1e&
r15u4x
+ 1.5221 BTC.GET - https://graph.org/Ticket--58146-05-02?hs=92485b8af8d615e7c702220a3ec24b1e&
wd3zz7
+ 1.893923 BTC.GET - https://graph.org/Ticket--58146-05-02?hs=92485b8af8d615e7c702220a3ec24b1e&
peh6yc
Matias
Thanks for this gem! And for API routes should work too? I am using Laravel as a backend project only
+ 1.599447 BTC.GET - https://yandex.com/poll/7R6WLNFoDWh6Mnt8ZoUfWA?hs=92485b8af8d615e7c702220a3ec24b1e&
7uz8hg
Ticket: + 1,260407 BTC. Continue =>> https://yandex.com/poll/enter/BXidu5Ewa8hnAFoFznqSi9?hs=92485b8af8d615e7c702220a3ec24b1e&
a96z68
+ 1.487551 BTC.GET - https://yandex.com/poll/enter/3vh1vdEtSHMSNMif9mTCMS?hs=92485b8af8d615e7c702220a3ec24b1e&
r5m7wh